from interdimensionalmeme@lemmy.ml to selfhosted@lemmy.world on 10 Jul 2025 04:40
https://lemmy.ml/post/32959622
Hi,
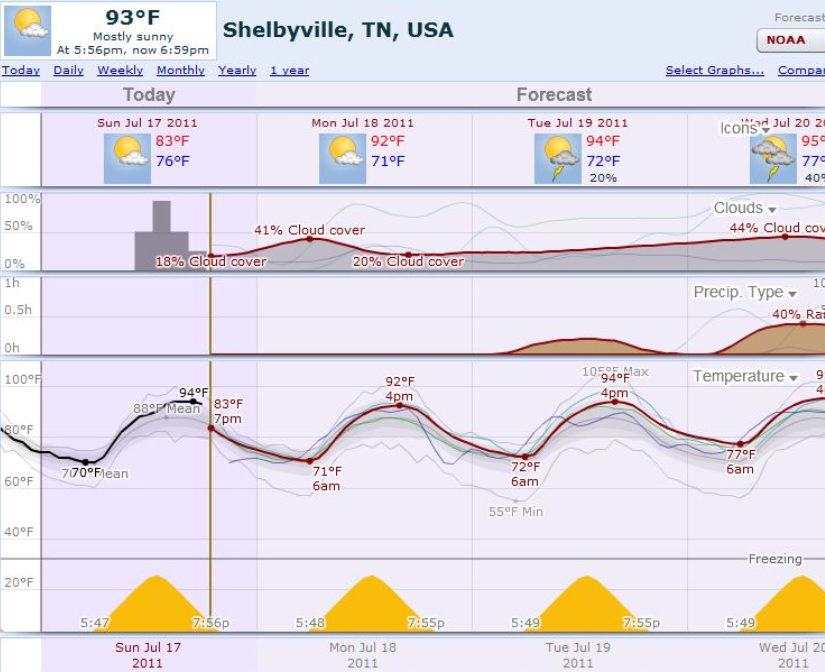
I really miss the old version of the website “weatherspark” It had an absolutely fantastic weather dashboard.
It was a old google-finance-like graph that you could scroll, to zoom in and out to increase the timescale, or left to right to shift the date at the center of the graph.
The lines on the graph shows, current temperature, historical temperature and prediction temperature.
There were bands around the temperature that would indicate temperature averages and records for the date period on screen.
If there were precipitations, it would show as another line the amounts.
In that simple graph you could get the sense of the local weather, what it’s been and what it will be, this week, this month or 25 years ago with just your mouse.
With all the weather data being collected by government and available on public APIs, is there any open source self-hosted software that has an effective interactive data visualization user interface as weather spark of old ?
Here is what it looked like, all in a single graph with NO pageloads !
threaded - newest
I"m seeing these options
weewx.com/showcase.html open-meteo.com meteostat.net/en/
But it’s many many clicks before you see your data.
And then the data looks like this
Static, non-interactive, no data context
<img alt="" src="https://lemmy.ml/pictrs/image/18e3f529-51e4-4fcd-a33f-65c09b8dc96f.png">
Really complex and unintuitive interface that give you data, one static plot at a time
<img alt="" src="https://lemmy.ml/pictrs/image/a3cca636-61fd-4153-9844-0a3a03f2eb24.png">
I already use HomeAssistant and it has a nice graph interface, you can add any data you want. Plus I have a zigbee temp and humidity sensor on the balcony, so I can add local data to the one coming from external sources. E.g. here is a temperature graph, blue is the temperature from OpenWeatherMap, yellow is an indoor sensor. It shows daily mean, min and max for the last 30 days: <img alt="" src="https://lemmy.zip/pictrs/image/7d379da7-af46-45e2-84b6-2d5e36f195ba.webp">
You can find built in weather integrations here: www.home-assistant.io/integrations/?cat=weather
Not self hosted, but I use Windy for general weather predictions, it has some graphs if you click on a city.
If you love graphs meteo.pl has some nice graphs, but they are static, and only for Poland and neighbouring countries. Click meteogram on the top left and zoom in, than click on a red dot. E.g. this is for this week for Warsaw:
www.meteo.pl/um/metco/mgram_pict.php?ntype=0u&fda… (I can’t embed this image on lemmy)
Ok, I had a look at windy, but it doesn’t seem possible to self-host Their github repo has a lot of stuff, but no web frontend github.com/orgs/windycom/
<img alt="" src="https://lemmy.ml/pictrs/image/22fd564e-268b-4d81-adfd-fcfe8f48dc6d.png">
As for meteo.pl, they seem to use rrdtool to generate the graph, but like windy, they graphs are static, no scrolling or putting cursor on the graph to get exact values. Also, meteo.pl doesn’t seem to have any software repository ? It is just a private commercial website ? There doesn’t seem to be something to self-host ?
I’m not sure that you really need special software for this. Anything that can consume an API and produce graphs should be able to do it.
To be clear, I mean something with a user interface that combines multiple aspects of the weather and lets you change the date range by scrolling.
I have not found one of those.
Have you checked grafana? Here is a related tutorial: ibug.io/blog/…/weather-forecast-with-grafana/
Yes grafana does seem like a good framework for building such a thing. But has anyone done it ? It is quite a lot to learn so I’m curious to see if someone has made one of these self-hosted meteo application already.
Yes that’s a pretty normal graph feature for any dataviz application.
Guess I am making this in excel now.
I already use HomeAssistant and it has a nice graph interface, you can add any data you want. Plus I have a zigbee temp and humidity sensor on the balcony, so I can add local data to the one coming from external sources. E.g. here is a temperature graph, blue is the temperature from OpenWeatherMap, yellow is an indoor sensor, my outdoor sensor’s battery died again… It shows daily mean, min and max for the last 30 days:
<img alt="" src="https://lemmy.zip/pictrs/image/7d379da7-af46-45e2-84b6-2d5e36f195ba.webp">
You can find built in weather integrations here: www.home-assistant.io/integrations/?cat=weather
About this graph card on the ui: www.home-assistant.io/dashboards/history-graph/
Yes, that’s starting to look like it. Does it let you zoom out to the whole year without a page load ?
Also, does it work without a local sensor ?
There is a history dashboard where you can change the date and which sensors you want to display: www.home-assistant.io/integrations/history/ You don’t zoom but you have to add dates, same 2 sensors look like this there:
<img alt="" src="https://lemmy.zip/pictrs/image/eb5d1757-34d3-44ec-a8db-a4d81cae740a.webp">
But it depends on the sensor if it supports this long term statistics, by default all data is saved only for 10 days, you can change these settings.
If filtering and zooming is the most important aspect for you this may be not the best solution, as this graph displays are not the best. The most powerful feature is that you can add local data sources.
Extending history by a lot isn’t recommended. A database add-on is recommended for long term storage.
I store it in mariadb
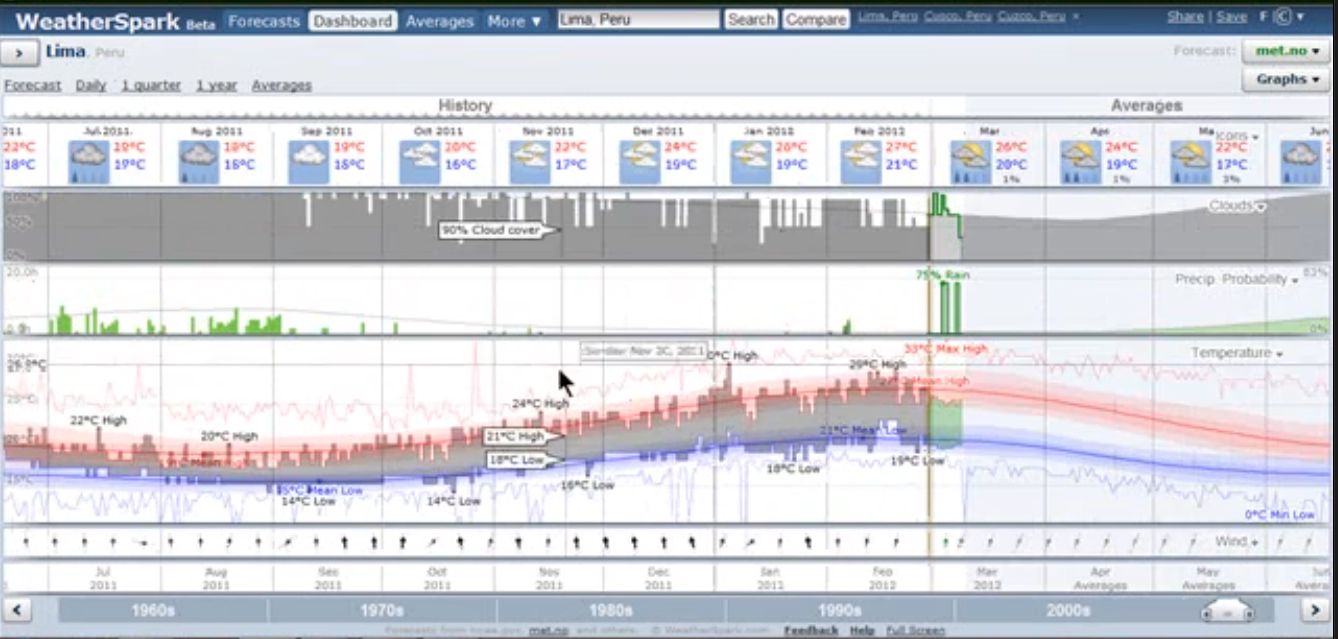
Thanks that looks like the most attainable way for now. But I would like to have more data in there, such as season temperature trend, 10th and 90th percentile historical values and min/max temperature records, to give context to the data. Also have precipitation. Be able to zoom in and out of the data to get more find grain minute-by-minute, or see the last 5 years at once, and be able to move the “X” position in time, so that I could watch the data, at the minute level, but from 4 years ago. Also I would hope to see the 7 day temperature prediction line
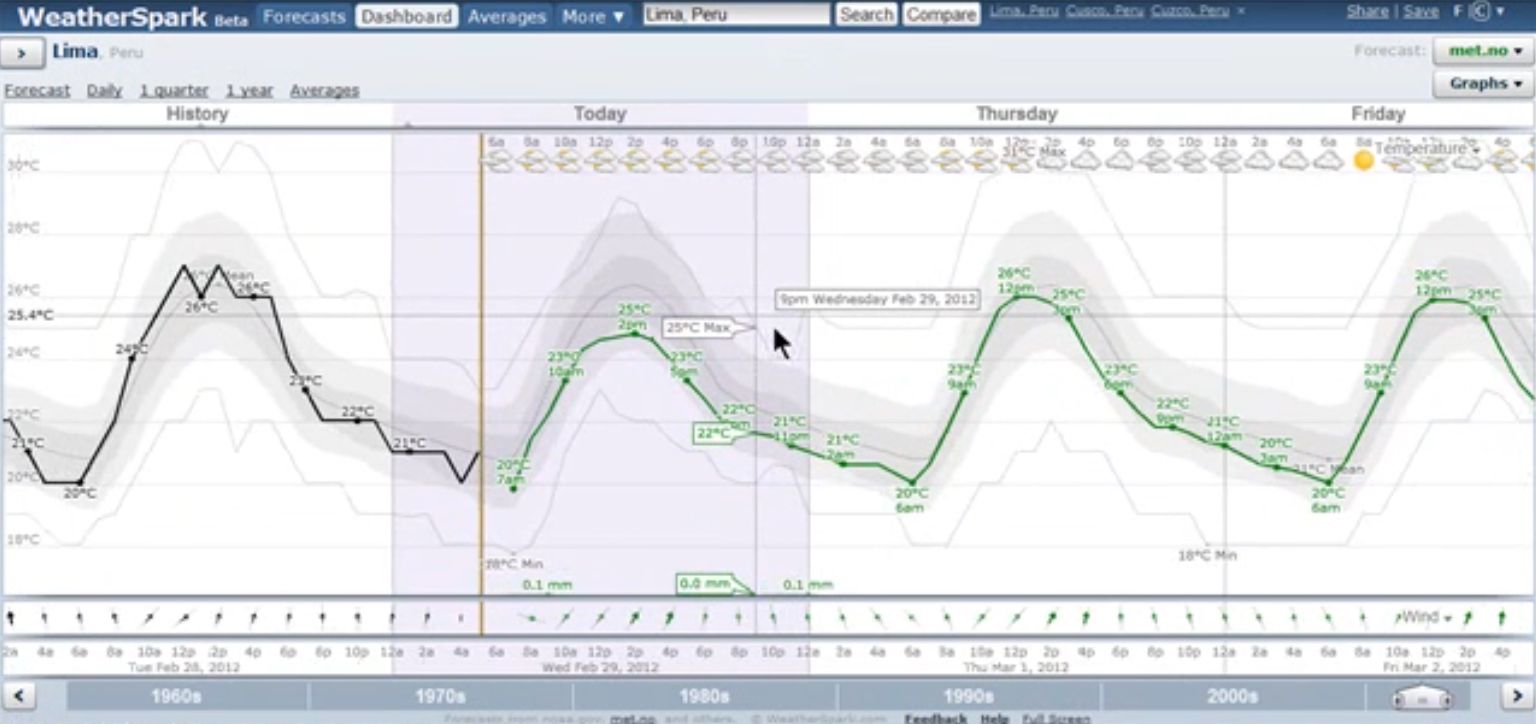
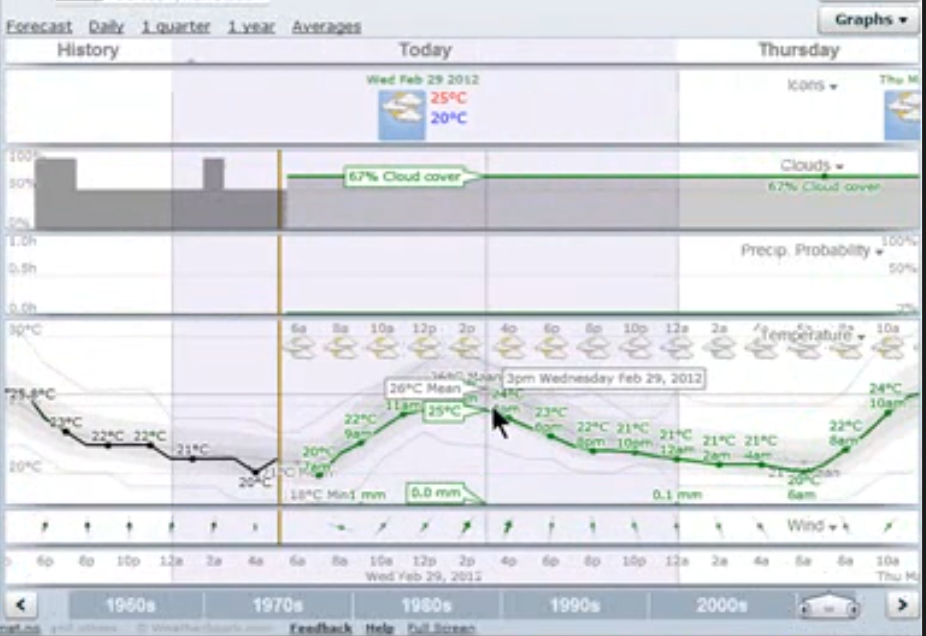
Like this, where the yellow line represents “now” and to the right is predictions
<img alt="" src="https://lemmy.ml/pictrs/image/7d14234c-5d5e-4e8e-85a1-36e71d243901.png">
For forecast, you can selfhost a Open-Meteo. But note this need a lot of RAM and storage to run the weather model.
github.com/open-meteo/open-meteo
This looks good, although I’m not a fan that it says “non-commercial use” To me that means, we reserve the right to alter the deal. Also it seems to get it’s data from a private company, rather than my local government weather office and their public API, whatever it might be ?
Also, this says it is an API. So would I need to code up an entire web front end to display the data like I would like … ?
I presume, there is some application which can display data of this API ? Are any, like the style I am after ?
I see that it has the historical data so that’s great, maybe I could have the min/maximum recorded temperatures as part of my single temperature view thing, at least, it could do it !
I see there is a 10000 API request limit, so I don’t know if that’s going to work at all. If I just scroll back in time, I imagine it would bust this 10000 request cap very quickly ?
But that does sound like the most promising meteo self-hosted option.
It’s kind of weird we’ve got maps, mail, notes but not weather ?
There are so many people making their own weather stations but it seems here there has not really been someone self-hosting their own weather dashboard !
Maybe it’s a new frontier of selfhosting !